Analysis workflow
Treat the corpus as a record of media attention and reported evaluation. Validate what the labels mean, keep policy stages distinct, and establish which findings survive reasonable choices about articles, outlets and timing.
Download the pipeline diagram (SVG) · PNG · See the current corrected results

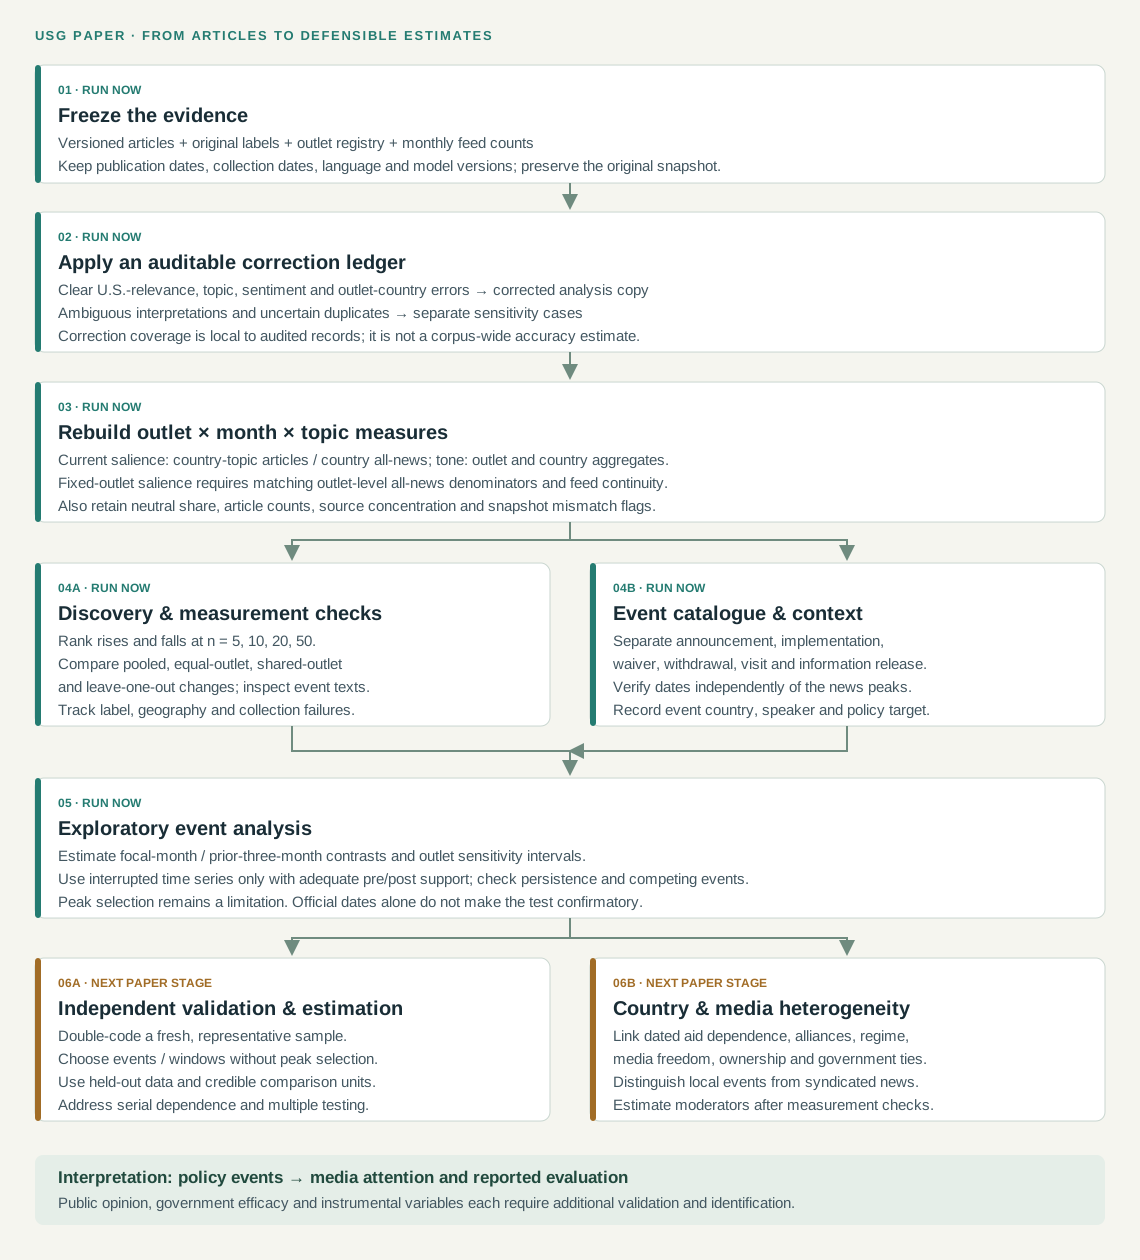
Keep three research questions separate
| Question | Outcome / unit | Interpretation |
|---|---|---|
| Did an event attract coverage? | Current: topic articles / all collected news, country × topic × month. Proposed fixed-outlet analysis requires same-outlet all-news denominators. | Attention within the observed media sample; not population exposure unless coverage is representative. |
| How was the U.S. evaluated? | Net tone; positive and negative attention; speaker and target codes | Balance of reported evaluations. Bad outcomes, criticism by the U.S. and criticism of the U.S. must be distinguished. |
| Why do countries and outlets respond differently? | Event-window changes linked to dated country and outlet attributes | Test mechanisms involving material exposure, strategic ties and media incentives after correcting geography and collection problems. |
What belongs in each analysis pass
Corrections and robustness
Apply explicit record decisions to a separate copy. Remove clearly misplaced outlets from the relevant country series. Keep uncertain corrections as alternatives. Recompute counts, tone, attention and ranks.
Compare n5/n10/n20/n50 screens and outlet specifications. A high threshold is a support screen, not proof of reliability; stable sign is not a significance test.
Exploratory event statistics
For each major episode, report changes, count support, outlet concentration and interval sensitivity. Assess pre-event trend and persistence only where sufficient months exist.
Resampling outlets addresses between-outlet sensitivity. It cannot repair shared wire dependence, classifier error or selection of the event after seeing the peak.
A measurement benchmark
Double-code a new sample covering ordinary periods, neutral labels and excluded articles. Evaluate U.S. relevance, topical class, target and sentiment separately, including language-specific errors.
Keep this benchmark separate from the purposive cases used to discover the failure modes.
A defensible event design
Freeze a bounded official event catalogue, outcome, timing, window and population of outlets. Start with paired three-month pre/post changes for continuously observed outlets, retaining zero-coverage events in attention. The Research methods tab specifies the estimand and sensitivity checks. Causal event studies require additional comparison units and identification.
For global shocks, unexposed controls may not exist. Descriptive cross-country heterogeneity can still be informative, but needs an explicit estimand.
Country and media variables to retain
Keep publication country, event location / affected country, quoted speaker and evaluated actor as separate fields. Add outlet ownership and government ties only with sourced dates. Country covariates should match the observation period: aid dependence, alliance/security relationships, regime characteristics, media freedom and regional context. Do not fill recent missing values with current attributes silently.
Reproduction order
- Freeze and hash the original panel, source-count exports and article retrieval. The first audit already retains these checks.
- Review correction_ledger.json; preserve each decision’s evidence, original label, replacement and applicability status.
- Run the corrected aggregation script, which validates count transfers, writes separate scenarios and reranks the entire period.
- Run the event-statistics script against the corrected source-month counts and the dated event register.
- Rebuild the figures, results tab and this pipeline tab; inspect both data validation and the rendered output.
1. Freeze the article snapshot and aggregate counts.
2. Apply the documented correction ledger to a separate analysis copy.
3. Rebuild denominators, tone, attention and threshold/outlet comparisons.
4. Run exploratory statistics against the dated event register.
5. Build figures and validate the report.

The independently sampled paper event catalogue is a proposed next stage.